Free WiFi with Randomness
There’s a few different pictures making their way around social media showing a complicated definite integral, and asking guests to evaluate it to get the password for free WiFi. Here’s an example:

I loved calculus back at uni, but uni was a fair while ago now and I’m more than a little dusty. I briefly attempted integrating the equation, looking up some terms I could remember (integration by parts? product rule?). But then I thought: if I’m sitting in a cafe trying to get WiFi, I’m going to want a quick and dirty numerical solution, not some beautiful mathematical ‘proof’.
So in this article I’m going to show you that quick and dirty solution. We’re going to use randomness via the Monte Carlo method to find a numerical solution to the definite integral, hopefully getting us access to that sweet free WiFi.
The Function
Let’s first define the function that is to be integrated in R, calling it \(f()\):
f <- function(x) {
    (x^3 * cos(x/2) + 1/2) * sqrt(4 - x^2)
}
We’ll than calculate \(f(x)\) for values of x between [-2,2], using a small increments between each x value to ensure we’re got reasonable accuracy for our subsequent calculations.
coords <-
    tibble(
        x = seq(from = -2, to = 2, by = 0.000001)
    ) |>
    mutate(y = f(x))
Let’s take a look at what the function looks like:

There’s two areas we’ll need to take into consideration when integrating: from -2 to around -1.2, and from -1.2 to 2. We need to remember that when integrating, regions above the x-axis evaluate to positive numbers, but regions below evaluate to negative numbers. When calculating the total, we’ll have to subtract that left region away from the right region.
We’re going to need the minimum and maximum values of \(f(x)\) in our calculation, so let’s pull them out:
min_max <-
    coords |>
    summarise(
        min_y = min(y),
        max_y = max(y)
    )

min_max
# A tibble: 1 × 2
  min_y max_y
  <dbl> <dbl>
1 -2.89  4.03
We can now move on to integrating this function.
Integration with Randomness
How are we going calculate a numerical answer to this integral? We’ll use randomness to help us:
- Draw a number of random x and y values from a uniform distribution.
- Calculate f(x) for each of the x random values.
- Determine whether f(x) above/below the random y and above/below the x-axis (both depending on the region).
- Find the ratio of points inside the areas versus points outside.
- Multiply this ratio by the total rectangular size of the area to find the definite integral area.
As a first step, let’s find the total area:
total_area <- (2 - -2) * (min_max[['max_y']] - min_max[['min_y']])
total_area
[1] 27.66986
As mentioned before, we’ll have to be wary of the area under the x-axis. We’ll use an encoding scheme where points outside are encoded as 0, points inside the positive area are encoded as 1, and points inside the negative area are encoded as -1. When can then simply take the mean() of these encoded values to determine the ratio of the area.
Here’s a first pass with 50,000 points to show how it works. I’ve omitted the graph rendering code:
ratio <-
    tibble(
        x = runif(50000, -2, 2),
        y = runif(50000, min_max[['min_y']], min_max[['max_y']]),
        fx = f(x)
    ) |>
    mutate(
        integral_encoding = case_when(
            # Above the x-axis, below the curve
            fx > 0 & y < fx & y > 0 ~ 1,
            # Below the x-axis, above the curve
            fx < 0 & y > fx & y < 0 ~ -1,
            # Everything else
            TRUE ~ 0
        )
    )
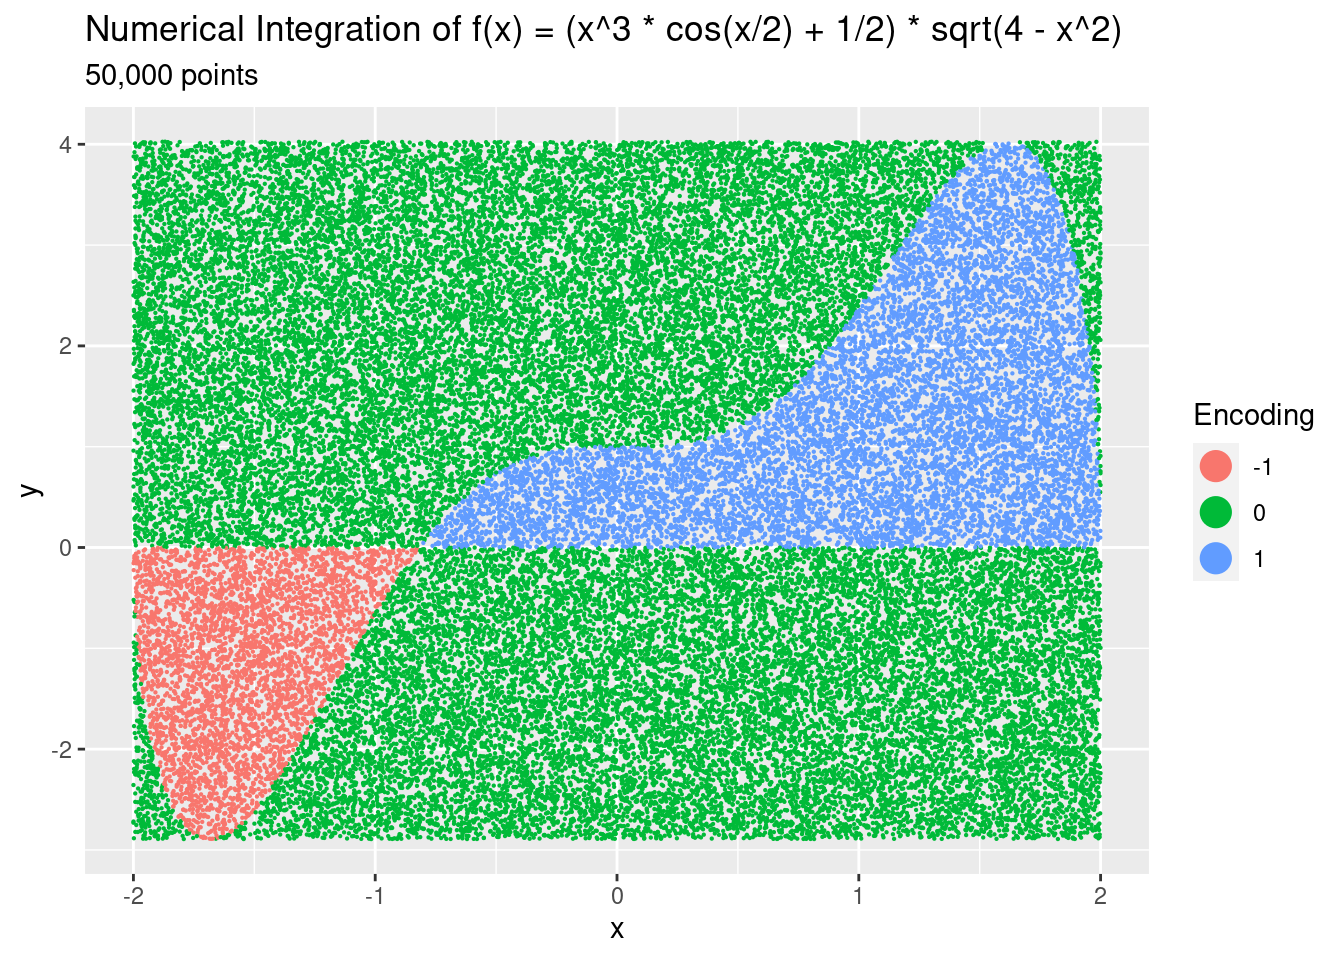
We see the random points, and their associated encoding which tells us which area they’re in. 50,000 points probably isn’t enough for an accurate answer, so we’ll do another run with 100,000,000 points. I’ve omitted the code in this run, but the results are in ratio. We then summarise the mean of the encoding, giving us our ratio.
integral_ratio <-
    ratio |>
    summarise(
        ratio = mean(integral_encoding)
    ) |>
    pull(ratio)
The calculated ratio is (drumroll):
integral_ratio
[1] 0.1134934
Just above 11%. Multiplying this by the total area gives us the answer we need:
total_area * integral_ratio
[1] 3.140347
Immediately we something interesting about that number: it’s very close to Pi. Remember we’re here for a quick and dirty way to get the WiFi password, so my first guess would be the first 10 digits of Pi.
Why didn’t we get the value? Setting aside any mistakes I may have made in my calculations above, I’d guess that the number of random points isn’t enough to get good enough precision. The reason I’ve not gone larger is I run out of memory trying to generate anything more than 100,000,000.
I’ve been a little deceptive, as there’s actually a quick and easy way to approximate the definite integral in base R. It doesn’t make for a very exciting article on its own:
integrate(f, -2, 2)
3.141593 with absolute error < 2e-09
Clearly this implementation is far superior, being faster and using less memory. A brief investigation leads me to believe it’s using adaptive quadrature under the hood.
What’s the Point?
You may rightfully say “your method is slow, uses lots of resources, and isn’t even that accurate in the end: why use it?". And you’d be correct, we could use the in-built integation function, or even use a 2-dimensional grid rather than random points. It’s probably not the best method.
But for more complicated integrals in higher dimensions, things become increasingly difficult. The integrate() function doesn’t work, and the compute resources required to use the grid method would increase exponentially by the dimension.
By using randomness, a reasonable approximation of a definite integral can still be achieved using less compute resources and despite the complexity of the problem.
Summary
In this post we looked at a numerical approach to calculating a definite integral. We generated random points and encoded them as to whether they were inside or outside of the integral area. We then used the ratio of this encoding and multiplied it by the total area of the region in question to get the answer.
If you’re out and about in need of free WiFi and you see this question (or a question like it) posed to get access, don’t be intimidated: go for the quick and dirty numerical approach. Either that, or get the first 10 digits of Pi from your phone and give that a crack.